
The Cobbler’s Children
Most consultants launch with credentials. A slide deck. Maybe a few logos from past employers.
We launched with a diagnostic on ourselves.
Here’s the uncomfortable truth about consulting: the industry is full of advisors who’ve never implemented their own advice. They prescribe automation but run their businesses on spreadsheets. They preach operational efficiency but can’t tell you their own cost per lead. They sell “AI transformation” while manually copying data between systems.
This is the cobbler’s children problem, scaled to an industry.
We decided to do something different. Before taking a single client, we would build the entire operating system we planned to sell. Every workflow. Every automation. Every agent. We would pressure-test our methodology on the business that mattered most to us: our own.
This wasn’t just practice. It was proof.
If D.H.A.T. works, it should work on a consulting firm starting from zero. If we couldn’t diagnose our own business gaps, automate our own processes, and transfer that knowledge into documented systems, we had no business selling that service to others.
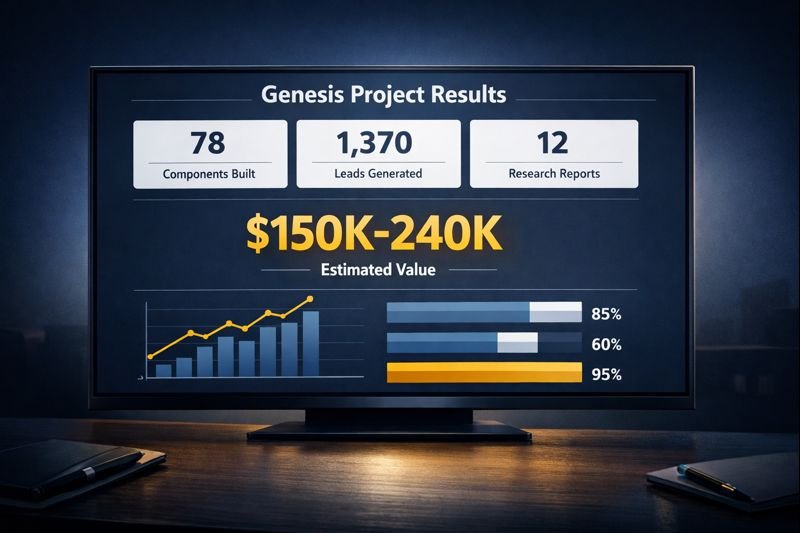
So we built. For months. And what emerged was 78 reusable AI components, 12+ deep research reports, a complete website (the one you’re reading), and a lead database of 1,370 fully enriched companies. Total system value: $150K-240K before we signed a single client.
$150K-240K in infrastructure built before our first client.
This is the story of how we did it.
Why We Diagnosed First: The D.H.A.T. Methodology

D.H.A.T. stands for Diagnose, Hub, Automate, Transfer.
Most automation vendors skip straight to building. A client asks for a chatbot, they build a chatbot. The client asks for an integration, they build an integration. Nobody stops to ask whether that’s actually the right thing to build.
This is how companies end up with expensive tools that don’t get used. The technology works. The problem is that nobody diagnosed whether that technology solved a real problem.
Diagnose comes first because prescription without diagnosis is malpractice. Before we wrote a single line of automation code, we needed to understand:
- What does a consulting firm actually need to operate?
- Where are the bottlenecks in business development?
- What manual processes consume the most time?
- What data exists, and what gaps need filling?
- What would a reusable component library look like?
Hub means building a central knowledge layer before scattering automation across tools. Every prompt, every workflow, every agent specification lives in one place. This prevents the chaos of disconnected automations that nobody can maintain.
Automate happens only after the first two phases. By then, you know exactly what to build and how it fits into the larger system. No wasted effort. No orphaned workflows.
Transfer means knowledge doesn’t stay locked in one person’s head. Documentation. Training. Handoff protocols. The system should work even when the original builder isn’t available.
We applied this framework to ourselves with the same rigor we’d bring to a client engagement. What we found surprised us.
The Diagnose Phase: What We Found
50+ Research Documents, 12+ Deep Research Reports

We started with research. Not casual Googling, but systematic investigation using Gemini Deep Research, a tool that synthesizes information across hundreds of sources into structured analysis.
Our research library now includes:
Home Services Vertical (4 Gemini Deep Research reports):
- ServiceTitan Integration Landscape
- Callback Recovery Economics
- Dispatcher Workflow Mapping
- Tech Stack Sprawl Analysis
Private Equity Vertical (5 Gemini Deep Research reports):
- Platform Ecosystem Mapping
- Deal Sourcing Workflows
- “Hands-Off Sponsor” Segment Analysis
- AI Transformation Lead Positioning
- Roll-Up Value Creation Economics
Cross-Functional Research (3+ Gemini Deep Research reports):
- Cross-Vertical Positioning Strategy
- Hormozi Grand Slam Offer Frameworks
- Cold Outreach Stack Comparison
Each deep research report took the AI roughly 30 minutes to generate 15,000-25,000 words of synthesized analysis. The equivalent would take a research analyst 40+ hours per report and cost $2,000-5,000 from a traditional research firm.
Total research investment: 12+ deep research reports that would cost $24,000-60,000 if outsourced. Our actual cost: a few hours of prompt engineering and synthesis per report.
Finding the Hidden Costs
The research revealed patterns we hadn’t expected. Across both verticals, we found operational waste hiding in plain sight. Not from lack of technology, but from underutilized technology.
In Home Services, our research (consolidated from 4 Gemini Deep Research reports) identified $324,000 in annual operational waste for a typical mid-market contractor.¹ The breakdown spans seven categories from missed calls to integration maintenance. (We’ll publish the full analysis in our upcoming Home Services case study.)
In Private Equity portfolio companies, we found similar patterns at higher stakes. At 14x EBITDA multiples, every dollar of permanent operational savings translates to $14 in Enterprise Value at exit.²
The research calls this pattern “utilization drift.” Organizations purchase sophisticated tools, implement them at baseline functionality, then never optimize due to adoption fatigue. Advanced features get shelved for a theoretical “Phase 2” that rarely arrives.
This represents our opportunity. These businesses don’t need new software. They need someone to fix what they already bought.
Cross-Vertical Validation
We repeated this research process for Private Equity portfolio companies, our secondary target market. Five additional Gemini Deep Research reports covered platform ecosystems, deal sourcing workflows, and value creation economics.
The PE research revealed a different but equally compelling opportunity. In a portfolio company trading at 14x EBITDA, every $1.00 of permanent operational savings translates to $14.00 in Enterprise Value at exit.² The math changes everything:
| Company Stage | EBITDA Range | Valuation Multiple |
|---|---|---|
| Local Operator | $500K-$1M | 3.0x-5.5x |
| Regional Player | $1M-$5M | 6.0x-8.5x |
| Emerging Platform | $5M-$10M | 9.0x-12.0x |
| Scaled Platform | $20M-$50M+ | 13.0x-16.0x+ |
A 5% pricing lag in a $5M company with 30% material costs bleeds $75,000 annually.² Route optimization reducing drive time from 45 to 27 minutes means one additional job every two days per technician.² These aren’t abstract efficiencies. They’re measurable margin expansion that compounds at exit.
Different pain points, similar patterns: technology investments underperforming expectations, manual processes filling gaps that automation should handle, data scattered across disconnected systems.
The research confirmed our positioning. We’re not selling “AI.” We’re selling operational leverage, specifically for businesses that have already invested in technology but aren’t getting the return they expected.
The Hub Phase: What We Built
With diagnosis complete, we built the central nervous system. This is where most automation projects fail. They build one-off solutions without considering how everything connects.
We built a component library designed for reuse.
11 Specialized Agents

An agent, in our system, is a Claude-powered specialist with a defined role, specific tools, and clear boundaries. Each agent knows what it’s responsible for and what it should hand off to others.
| Agent | Role |
|---|---|
| project-manager | Client delivery tracking, milestone management, communications |
| crm-coordinator | Lead qualification, follow-up sequences, pipeline health |
| content-creator | Blog posts, social content, email sequences, case studies |
| product-developer | Service offerings, methodology documentation, new products |
| ai-hub-manager | Knowledge base maintenance, prompt library, workflow docs |
| automation-developer | n8n workflow creation, API integrations, automation logic |
| code-developer | Scripts, utilities, custom tools |
| frontend-developer | WordPress, React, responsive design, accessibility |
| database-manager | PostgreSQL operations, schema management, data integrity |
| chief-of-staff | Strategic prioritization, decision frameworks, coaching |
| prompt-engineer | Prompt optimization, agent system prompts, quality control |
Each agent has a specification document (what we call AGENTS.md) that defines:
- What problems it solves
- What tools it can access
- What it cannot do
- When to escalate to another agent
- How to verify its work is complete
This isn’t just documentation. It’s the coordination layer that prevents agents from stepping on each other’s work or making conflicting decisions.
28 Commands for Repeatable Workflows
Commands are one-liner triggers that kick off complex multi-step processes. Instead of manually remembering “first do this, then that, then check this,” a command handles the sequence.
Examples from our library:
| Command | What It Does |
|---|---|
/project-init | Creates folder structure, templates, tracking docs for new client |
/lead-qualify | Runs enrichment, scoring, and assessment on a new lead |
/content-brief | Generates structured brief from topic idea |
/case-study | Builds data-driven case study from engagement data |
/debug-workflow | Analyzes n8n execution history to find failure points |
/deep-dive | Three-phase research: preliminary scan, context analysis, deep synthesis |
Each command calls the appropriate agents, passes the right context, and handles handoffs. The person triggering the command doesn’t need to know the internal mechanics. They just need the outcome.
39 Skills as Reusable Capabilities
Skills are modular capabilities that multiple agents can use. Think of them as shared libraries in software development.
Examples:
- google-drive-integrator: Read, write, and sync with Google Docs and Sheets
- database-ops: PostgreSQL query patterns and validation
- frontend-design: Design tokens, WordPress patterns, accessibility rules
- content-qc: Quality checks for brand voice, AI cliche detection, authenticity
- lead-enrichment: Company data gathering from multiple sources
When we build a new agent, we don’t start from scratch. We compose it from existing skills. This cuts development time by half or more and keeps the system consistent.
The Coordination Layer
The real value isn’t in any single component. It’s in how they connect.
Our AGENTS.md file (2,000+ lines) defines the handoff rules. When should crm-coordinator pass a qualified lead to project-manager? When should automation-developer escalate a complex integration to code-developer? What happens when two agents need the same resource?
This is the infrastructure that allows 11 agents to operate without colliding. In a human organization, this would be the org chart plus the unwritten rules everyone learns over years. We made it explicit from day one.
The Automate Phase: What We Automated
With the hub in place, automation became straightforward. We knew exactly what to build.
21 Active Workflows, 350+ Nodes
Our n8n instance runs 21 production workflows with over 350 automation nodes. Each workflow handles a specific operational process.
Lead Generation Pipeline:
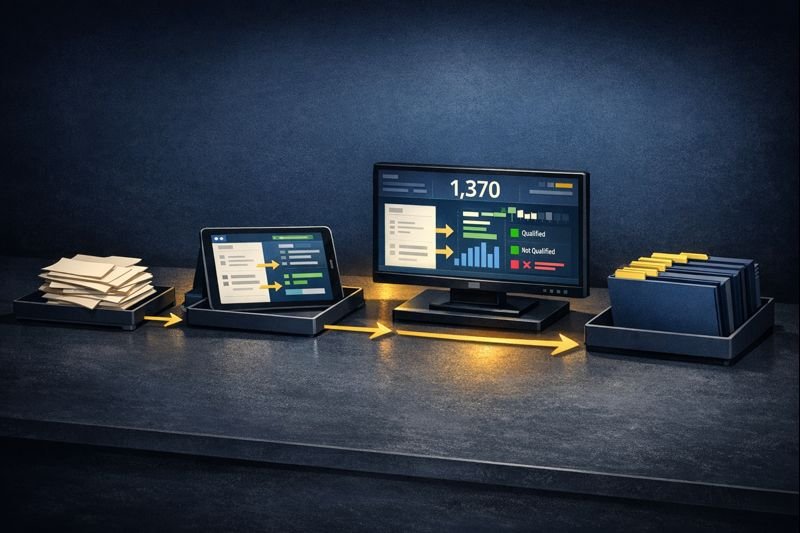
The crown jewel is our lead generation system, a multi-stage pipeline that takes a target vertical and produces fully enriched, scored, and assessed prospects.
Stage 1: Discovery
- Input: Industry vertical and geographic parameters
- Process: Google Places API queries, initial company extraction
- Output: Raw company list with basic data
Stage 2: Enrichment
- Input: Raw company list
- Process: Website scraping, LinkedIn lookup, tech stack detection, employee count estimation
- Output: Enriched company profiles with 20+ data points per record
Stage 3: Scoring
- Input: Enriched profiles
- Process: Six-dimension scoring model (tech maturity, growth signals, pain indicators, engagement likelihood, deal size potential, timing indicators)
- Output: Prioritized list with scores and reasoning
Stage 4: Assessment
- Input: Scored leads
- Process: AI-generated readiness assessment, gap analysis, personalized outreach angle
- Output: Full prospect intelligence file
What’s in Each Enriched Lead:
| Data Category | Fields |
|---|---|
| Company Basics | Name, address, phone, website, employee count estimate |
| Tech Signals | 20 technology indicators (FSM platform, CRM, payment processor, etc.) |
| Scoring | 6-dimension score with AI-generated reasoning for each dimension |
| AI Readiness | Assessment level, specific gaps identified, recommended approach |
| Outreach Intel | Personalized angle, relevant pain points, conversation starters |
| Qualification | 12+ probing questions organized by category |
Each lead that enters our pipeline emerges with this complete intelligence package. No manual research required.
Other Production Workflows:
| Category | Workflows |
|---|---|
| Lead Processing | Google Places discovery, enrichment, scoring, CRM sync |
| Content Operations | Newsletter publishing, social scheduling, content distribution |
| Client Management | Project status updates, milestone tracking, deliverable notifications |
| System Maintenance | Database backups, error alerting, health monitoring |
| Assessment Processing | Contact form intake, AI readiness scoring, auto-response |
The Website You’re Reading Was Built With This System
Here’s proof you can verify right now: the entire HAIBRID Consulting website was built using the system we’re describing.

Every page went through our agent workflow:
| Page | Agents Used | Deliverables |
|---|---|---|
| Homepage | chief-of-staff, content-creator, frontend-developer | Story framework, 5 copy versions, implementation spec |
| Home Services | chief-of-staff, content-creator | Pain point research synthesis, 8-section landing page |
| Private Equity | chief-of-staff, content-creator | Dual entry-point strategy, messaging architecture |
| About | content-creator, frontend-developer | Founder positioning, 5-section wireframe |
| AI Readiness Assessment | automation-developer, database-manager | 11-screen form, 4-pillar scoring, n8n processor, PostgreSQL storage |
| Contact | content-creator, automation-developer | Two-path layout, intake workflow, CRM integration |
The AI Readiness Assessment alone demonstrates the full D.H.A.T. cycle:
- Diagnose: We researched what questions actually predict AI readiness
- Hub: We built reusable form components and scoring logic
- Automate: n8n workflow processes submissions, scores responses, syncs to CRM, sends personalized results
- Transfer: The assessment runs 24/7 without human intervention
6 pages, 22+ image prompts, 5 n8n workflows all built through our agent system.
This isn’t a demo. It’s the production website you’re reading right now.
The $85K+ of Manual Work Eliminated
Let’s do the math on lead enrichment alone.
We’ve processed 1,370 companies through the full pipeline. Manual equivalent for each company:
- Finding company data: 15 minutes
- Tech stack research: 20 minutes
- Scoring and qualification: 25 minutes
- Writing personalized notes: 15 minutes
- Total per company: 75 minutes
At 1,370 companies: 1,712.5 hours of manual work.
At a conservative $50/hour for research assistance, that’s $85,625 in labor value.
And this is just lead enrichment. Add the newsletter automation, content distribution, client tracking, and system maintenance, and the total operational value exceeds $100,000 annually.
The Transfer Moment: This Case Study
Here’s where D.H.A.T. completes its cycle.
Transfer is the phase where knowledge moves from the builder to the documentation, from the individual to the system. It’s what separates a one-off project from a sustainable capability.
This case study is part of our transfer.
By documenting what we built, how we built it, and what results it produced, we’re doing three things:
1. Proving the methodology works.
D.H.A.T. isn’t theoretical. We ran it on ourselves with measurable outcomes. 78 components. $100K+ in system value. 1,370 enriched leads. These aren’t projections. They exist.
2. Showing clients what to expect.
When we propose an engagement, clients now have a reference point. They can see the depth of research we conduct (4 Gemini reports), the structure of what we build (agents, commands, skills, workflows), and the documentation that ensures knowledge transfer (this case study, AGENTS.md, workflow specifications).
3. Demonstrating the “we did it ourselves first” advantage.
Any vendor can claim expertise. We’re showing our work. The same diagnostic process we used on ourselves is what we’ll use on your business. The same component architecture we built for our operations is what we’ll customize for yours.
This is the difference between consultants who advise and operators who build.
By the Numbers: What We Built
| Category | Count |
|---|---|
| n8n Workflows (active) | 21 |
| Claude Agents | 11 |
| Claude Commands | 28 |
| Claude Skills | 39 |
| Total Reusable Components | 78 |
| Automation Nodes | 350+ |
| Lead Database | 1,370 companies |
| Data Points per Lead | 20+ |
| Scoring Dimensions | 6 |
| Research Documents | 50+ |
| Gemini Deep Research Reports | 12+ |
| Website Pages Built | 6 |
| Image Prompts Created | 22+ |
78 components + 1,370 leads + 12 research reports
Economic Value Summary
| Asset | Manual Equivalent | Estimated Value |
|---|---|---|
| Deep Research Reports (12+) | Outsourced research firm | $24,000-60,000 |
| Lead Enrichment (1,370 companies) | 1,712 hours manual research | $85,000+ |
| n8n Workflow Library (21 workflows) | External development | $10,000-42,000 |
| Agent/Command/Skill Library | Internal development time | $15,000-30,000 |
| Website Build (6 pages + assessment) | Agency development | $15,000-25,000 |
| Total System Value | $149,000-242,000 |
$150K-240K in system value before our first client
This is the infrastructure that existed before our first client engagement. Not a pitch deck. Not a website. An operational system that works.
What This Means for Your Business
We built this for two reasons.
First, because we believe consultants should practice what they preach. If we’re going to sell operational efficiency, we should run an operationally efficient business.
Second, because everything we built is transferable. The same diagnostic process that identified our $324K waste target works on your business. The same component architecture that powers our lead pipeline can power your customer operations. The same transfer protocols that document our system can document yours.
The difference is we’ve already done the hard work. The methodology is tested. The infrastructure exists. The patterns are proven.
Your engagement doesn’t start from zero. It starts from 78 components and a team that’s already pressure-tested the approach.
Take the Next Step
Ready to diagnose your business?

Our AI Readiness Assessment is the first step in the D.H.A.T. process. In 10 minutes, you’ll answer questions about your current operations, technology stack, and growth goals. Our system will analyze your responses and deliver:
- AI Readiness Score across 6 dimensions
- Specific gaps identified in your current setup
- Recommended starting points for automation
- Estimated value of addressing each gap
No sales call required. No commitment. Just a diagnostic.
Or, if you already know you’re ready for a conversation:
We’ll spend 30 minutes understanding your situation and tell you honestly whether we can help. If we can, we’ll outline what an engagement would look like. If we can’t, we’ll tell you who might be a better fit.
The same diagnostic rigor we applied to ourselves, applied to you.
Sources
Research Methodology: This case study draws from 12+ Gemini Deep Research reports across Home Services, Private Equity, and cross-functional topics. Each report synthesizes hundreds of sources into 15,000-25,000 word analyses.
¹ Haibrid Consulting Research Synthesis, January 2026. The $324K figure consolidates 4 Home Services-focused Gemini reports: ServiceTitan Integration Pain Points, Callback Recovery Economics, Dispatcher Workflow Mapping, and Tech Stack Sprawl Analysis. Full breakdown available in our Home Services case study.
² Haibrid Consulting PE Roll-Up Value Creation Research, January 2026. External sources: First Page Sage, “HVAC EBITDA & Valuation Multiples 2025”; Founders Advisors, “Home Services M&A Update Q1 2024”; Kroll, “M&A in Residential HVAC Services”; Axial, “HVAC Private Equity Analysis.”
This case study documents the Genesis Phase of HAIBRID Consulting, completed January 2026. All metrics are from actual system data. Industry statistics are cited from original research sources.
Hi, this is a comment.
To get started with moderating, editing, and deleting comments, please visit the Comments screen in the dashboard.
Commenter avatars come from Gravatar.