
The Number That Should Keep You Up at Night
35.7%.
That’s the percentage of home services contractors in our database with zero customer-facing digital tools. No online booking. No chat widget. No scheduling form. Nothing between a potential customer and your voicemail.
And the other end of the spectrum? Only 3.2% have what we’d call a complete digital front door: the combination of online booking, live chat, and scheduling that lets customers engage 24/7.
This isn’t opinion. It’s data from our analysis of 1,375 home services companies across 23 major metro areas.
The gap between those two numbers represents hundreds of thousands of dollars in annual revenue. For some contractors, it represents the difference between growth and stagnation.
We call it the Digital Cliff.
[Not sure where you fall? The Tech Stack Audit Checklist has 20 signals.]
What We Analyzed
Between December 2025 and January 2026, we built a database of 1,375 home services companies using Google Places data, enriched with website technology detection and operational scoring.
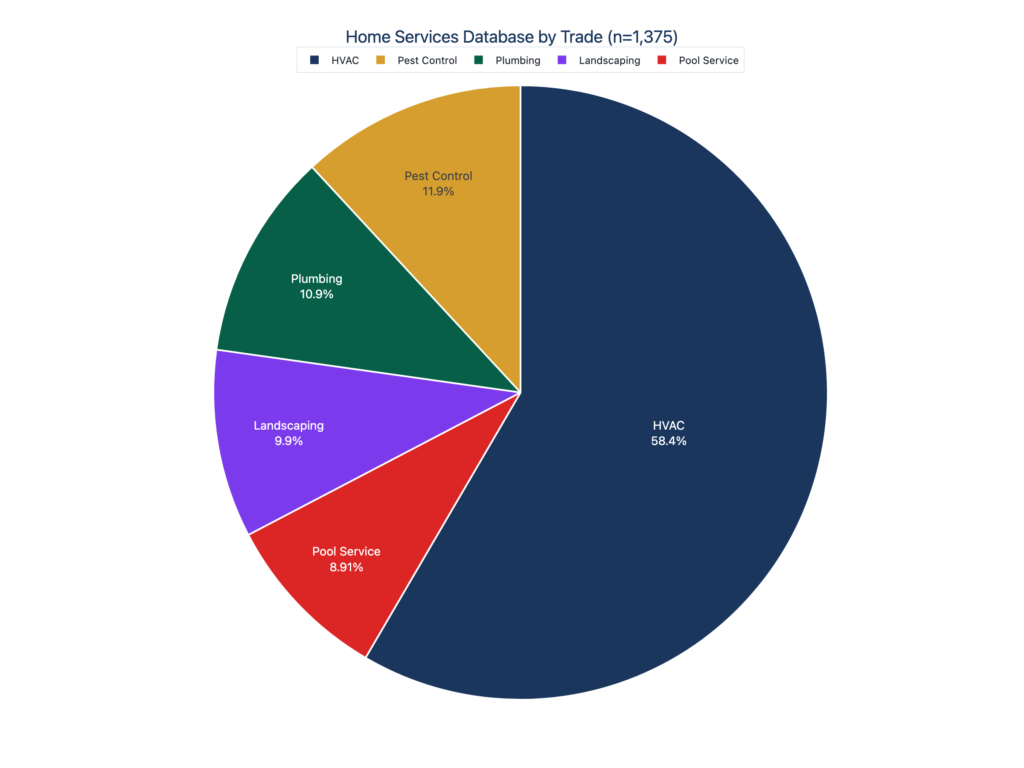
| Trade | Sample Size | % of Database |
|---|---|---|
| HVAC | 807 | 59% |
| Pest Control | 160 | 12% |
| Plumbing | 149 | 11% |
| Landscaping | 137 | 10% |
| Pool Service | 122 | 9% |
Geographic distribution: Texas (27%), Florida (24%), California (13%), with the remainder spread across 25 additional states.
Every company was scored on digital presence, technology signals, and operational maturity. The patterns that emerged surprised us. They’ll likely surprise you too.
The Digital Front Door Problem
A digital front door is simple: it’s the combination of tools that let customers engage with your business when they’re ready, not when you’re available.
Here’s what our data shows:
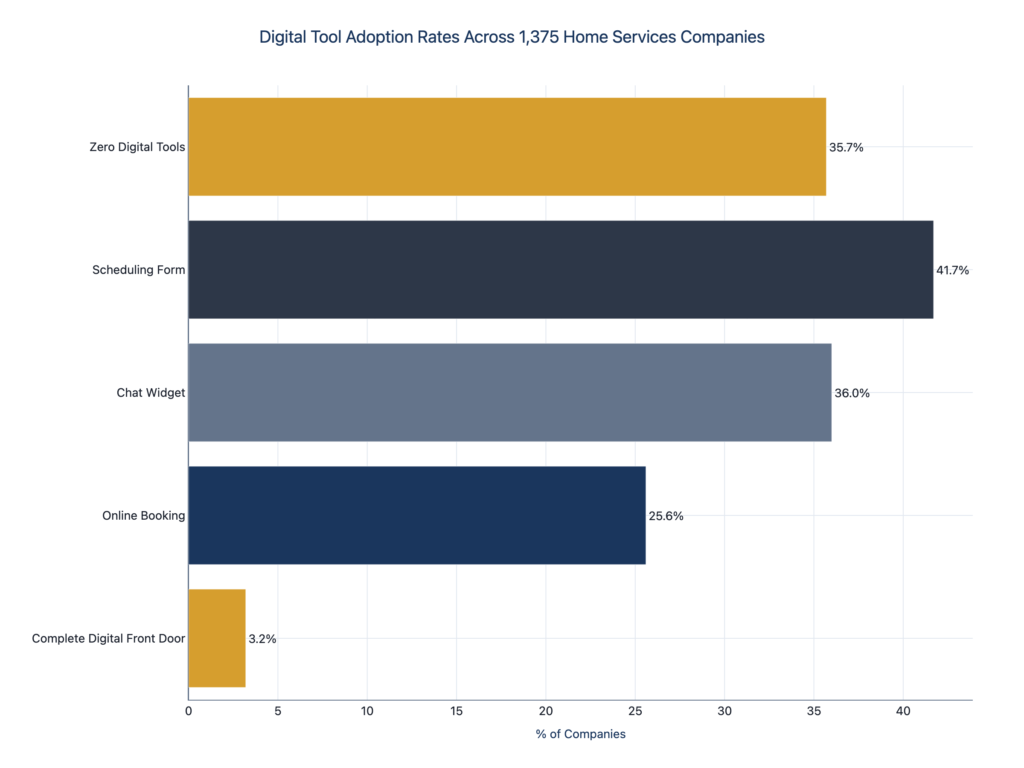
| Capability | Adoption Rate | % Without |
|---|---|---|
| Scheduling Form | 41.7% | 58.3% |
| Chat Widget | 36.0% | 64.0% |
| Online Booking | 25.6% | 74.4% |
| Complete Digital Front Door | 3.2% | 96.8% |
| Zero Digital Tools | 35.7% | — |
Read that again. Almost three-quarters of contractors have no online booking. More than a third have no digital customer acquisition tools at all.
This matters because of a number the industry already knows but consistently ignores.
The 78% First-Responder Rule
Industry research is unambiguous: 78% of customers purchase from the first company to respond.
Not the cheapest. Not the best-reviewed. The first.
And yet the average response time across the industry? Forty-seven hours.
That gap is the opportunity. Customers are ready to buy from whoever calls back first. And the industry average is two days.
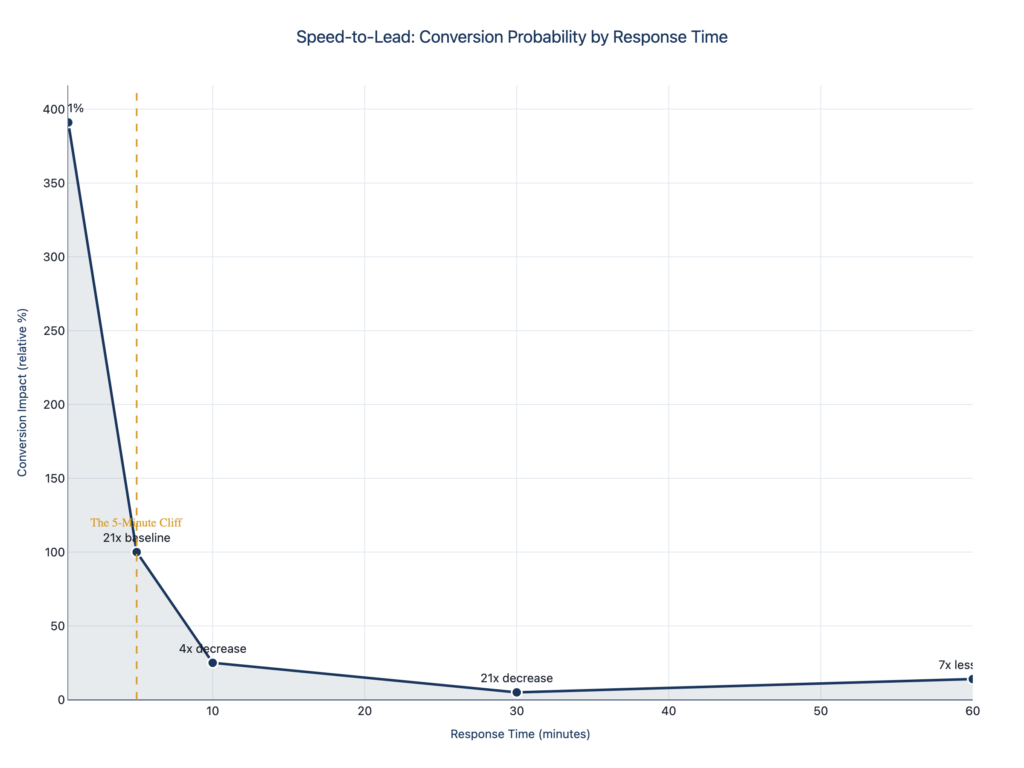
| Response Time | Conversion Impact |
|---|---|
| < 1 minute | +391% improvement |
| < 5 minutes | 21x more likely to qualify |
| 10 minutes | 4x decrease in odds |
| 30 minutes | 21x decrease in odds |
| > 1 hour | 7x less likely to connect |
The data shows a cliff at the 5-minute mark. After that, your odds collapse.
Now go back to those adoption numbers. 74.4% of contractors have no online booking. 64% have no chat widget. 35.7% have nothing at all.
These businesses aren’t losing to competitors with better trucks or lower prices. They’re losing to competitors who simply answer faster.
[Get the Response Time Benchmarks for your trade.]
The HVAC Paradox
Here’s where the data gets interesting.
HVAC represents 59% of our database, the largest segment. HVAC companies also have the highest average ticket sizes ($7,500-$14,000 for replacements) and typically the largest technology budgets.
Logic would suggest they’d lead in digital adoption.
They don’t.
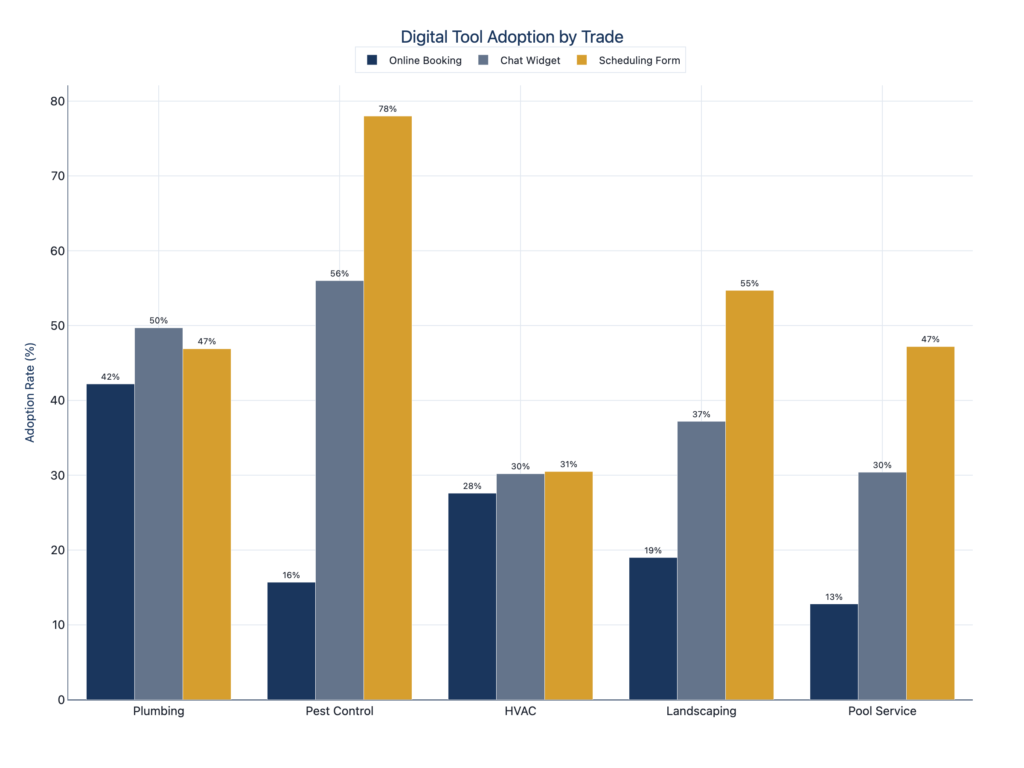
| Trade | Online Booking | Chat Widget | Scheduling Form |
|---|---|---|---|
| Plumbing | 42.2% | 49.7% | 46.9% |
| Pest Control | 15.7% | 56.0% | 78.0% |
| HVAC | 27.6% | 30.2% | 30.5% |
| Landscaping | 19.0% | 37.2% | 54.7% |
| Pool Service | 12.8% | 30.4% | 47.2% |
HVAC lags behind Plumbing in online booking by nearly 15 percentage points. Pest Control—with the lowest average ticket sizes—leads in both chat adoption and scheduling forms.
The pattern suggests something counterintuitive: larger budgets don’t drive digital maturity. If anything, HVAC’s complexity and higher-touch sales process may be creating resistance to digital customer acquisition.
The question is whether that resistance is strategic or simply inertia.
The $324K Problem
Behind every adoption gap is a dollar amount.
Our research, consolidated from four deep analysis reports on ServiceTitan integration, callback recovery economics, dispatcher workflows, and tech stack sprawl, quantifies the operational waste for a typical $5M mid-market contractor.
The number: $324,000 annually. That’s 6.5% of revenue.
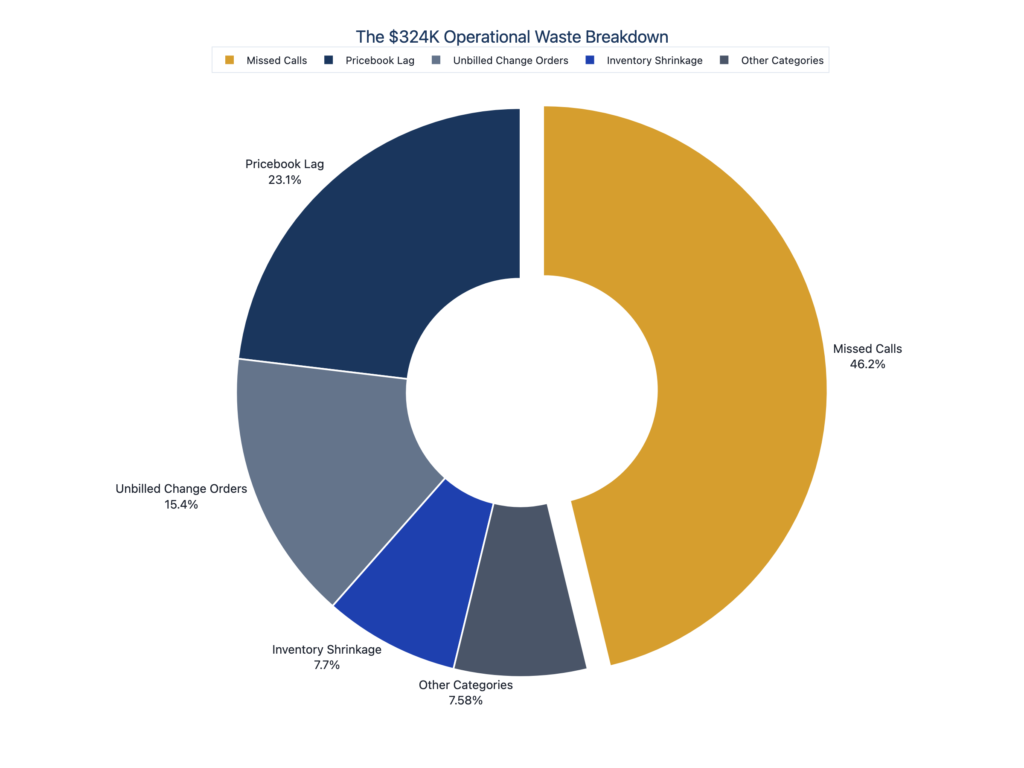
Here’s what we can show publicly:
| Category | Annual Impact |
|---|---|
| Missed Calls | $150,000+ |
| Pricebook Lag | $75,000 |
| Unbilled Change Orders | $50,000 |
| Inventory Shrinkage | $25,000 |
| Other Categories | $24,600 |
| Total | $324,600 |
The Hidden Leak: The largest waste category accounts for 46% of the $324K—nearly half. It’s something controllers rarely track, and dispatchers never see. The Cliff Index shows where you likely stand—and what the top 10% do differently.
Why Expensive Software Doesn’t Fix This
Here’s the uncomfortable truth: most of these contractors already have the technology.
Our research shows 45% of ServiceTitan users lack integrated online booking. They’re paying $30,000-$50,000 annually for enterprise-grade field service management software.
They bought the Ferrari. They’re driving it in first gear.
The Utilization Drift Pattern
We call it “utilization drift.” Here’s how it works:
- Contractor purchases sophisticated FSM platform
- Implementation team gets core features live (dispatch, invoicing, basic scheduling)
- Organization hits “adoption fatigue,” exhausted from the change, ready to just run the business
- Advanced features get shelved for a theoretical “Phase 2”
- Phase 2 never arrives
- Meanwhile, shadow systems emerge: Excel for commissions, sticky notes for dispatch, WhatsApp for tech communication
- The platform’s value proposition slowly drains away
This isn’t speculation. We see it in the data. Companies with enterprise software but no digital front door. Organizations paying for Marketing Pro but still manually tracking leads in spreadsheets.
The Benchmark Paradox: Companies scoring “excellent” on FSM dashboards still lose $200K+ annually to operational gaps. The dashboard measures usage, not effectiveness. It tells you features are being clicked, not whether they’re generating ROI.
The Cliff Index includes a 5-question self-assessment that cuts past vanity metrics. For deeper analysis, our 15-Dimension Diagnostic goes further.
The Automation Gap
Digital adoption is the front door. Automation maturity is the engine room.
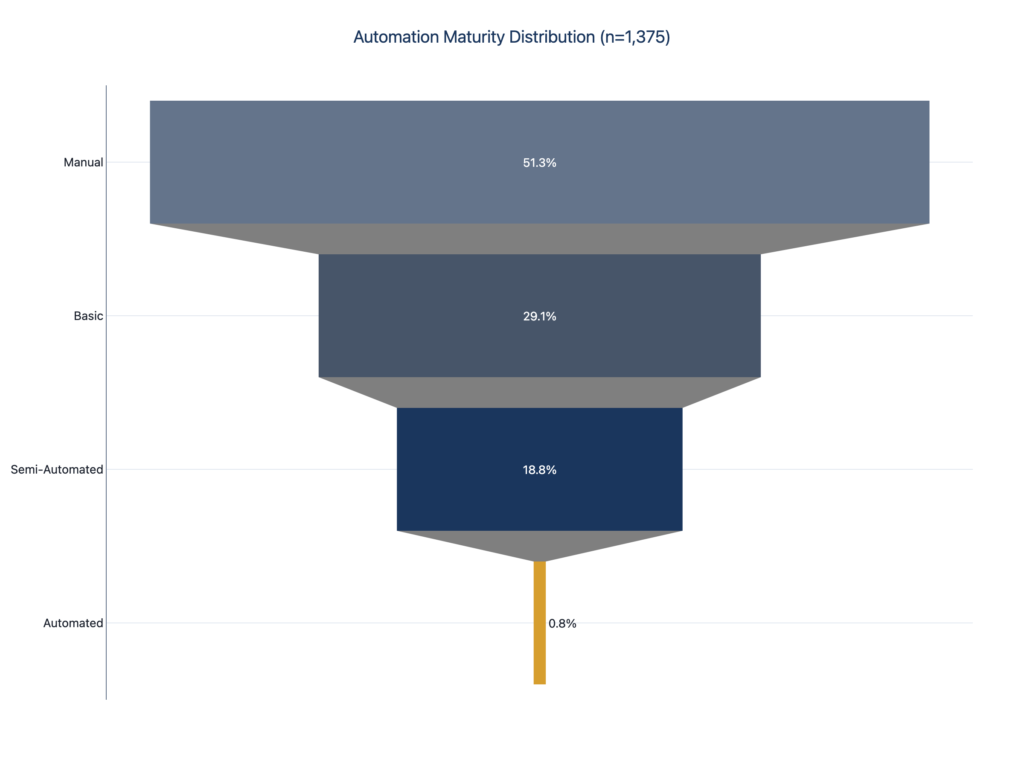
| Stage | Definition | % of Database |
|---|---|---|
| Manual | No automation, all processes require human action | 51.3% |
| Basic | Some email templates, simple scheduling | 29.1% |
| Semi-Automated | Partial workflow automation, some integration | 18.8% |
| Automated | End-to-end workflows, minimal manual intervention | 0.8% |
That bottom number is the tell. 0.8%. That’s 11 companies out of 1,375 with true operational automation.
Half the market is still fully manual. Dispatchers looking at four screens. Controllers spending three days a month reconciling QuickBooks. Office managers double-entering data because integrations fail.
The gap isn’t technology. It’s implementation.
The AI Readiness Crisis
AI is everywhere in the conversation. It’s mostly absent from the operations.
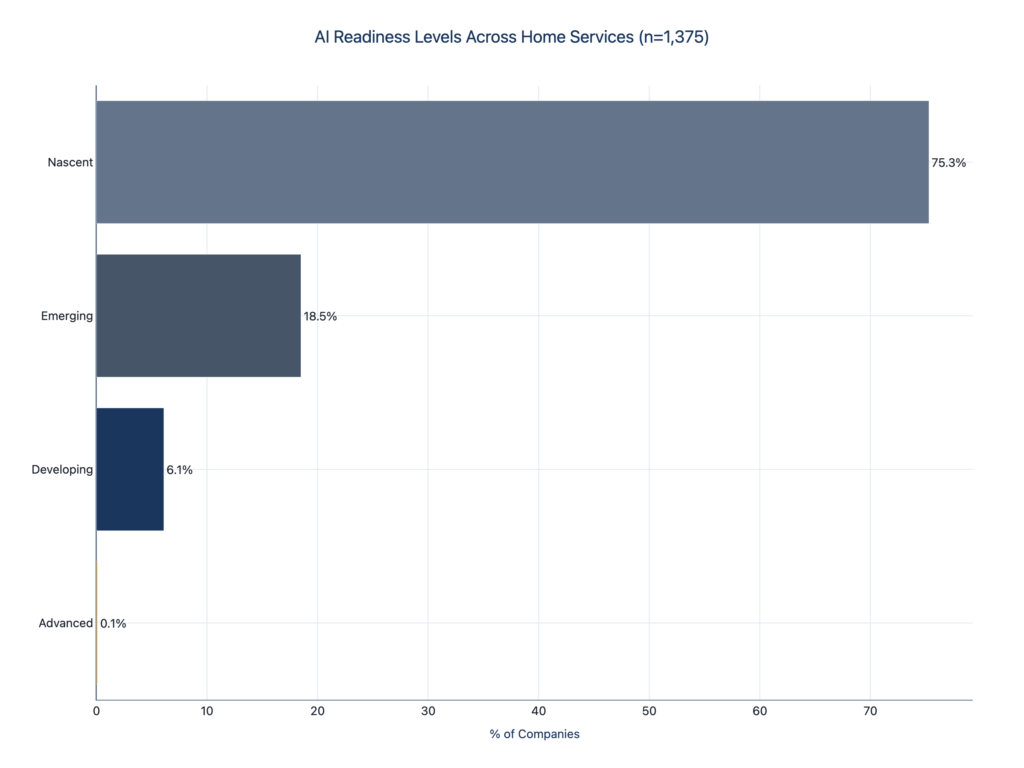
| Readiness Level | Definition | % of Database |
|---|---|---|
| Nascent | No foundation for AI adoption | 75.3% |
| Emerging | Some digital infrastructure, not AI-ready | 18.5% |
| Developing | Partial foundation, specific use cases possible | 6.1% |
| Advanced | Full foundation, ready for AI operations | 0.1% |
75.3% of home services companies lack the digital foundation needed for AI-powered operations.
This isn’t about budget or willingness. It’s about prerequisites. You can’t deploy an AI scheduling assistant if your scheduling lives in sticky notes. You can’t use AI for customer communication if you have no chat infrastructure. You can’t automate callbacks if you don’t track missed calls.
The AI conversation is premature for three-quarters of the market. The digital foundation has to come first.
What This Means for Your Business
If you’re reading this, you’re probably not in the 35.7% with zero digital tools. But you might be in the 96.8% without a complete digital front door. Or the 45% with expensive software you’re not fully using. Or the 51.3% still running on manual processes.
These aren’t permanent conditions. They’re fixable.
But fixing them requires diagnosis first. You can’t optimize what you haven’t measured.
That’s why we built the Cliff Index.
See Where You Stand
The Cliff Index puts our research to work for your operation:
Trade-Specific Benchmarks Where HVAC, Plumbing, Pest Control, Landscaping, and Pool Service companies actually stand. Compare against 1,380 companies, not generic “small business” averages.
5-Question Self-Assessment Find your position in 3 minutes. Leader, Average, or Laggard on the five dimensions that matter: Speed-to-Lead, Tech Utilization, Data Quality, Process Automation, and Team Adoption.
Cost Calculator What your score means in dollars. From $20K annual leak (top performers) to $150K+ (companies on the wrong side of the cliff).
What Leaders Do Differently The specific operational choices that put the top 10% ahead. Not theory. Patterns from actual data.
Ready for a Deeper Diagnosis?
The Cliff Index tells you where you stand. For some operations, that’s enough to identify and prioritize the gaps.
For others, the patterns are more complex. The utilization drift has spread further. The shadow systems are deeply embedded. The technology debt requires surgical intervention.
That’s what we do.
HAIBRID Consulting brings consulting rigor to AI and automation. We diagnose before we build. We focus on your existing technology investment, not new software. And we don’t just deliver. We ensure adoption.
If your self-assessment reveals gaps you don’t have time to fix internally, let’s talk.
We’ll spend 30 minutes understanding your situation and tell you honestly whether we can help. If we can, we’ll outline what an engagement looks like. If we can’t, we’ll point you to someone who can.
Methodology and Limitations
Data Sources:
- Primary database: 1,375 home services companies identified via Google Places API, December 2025 – January 2026
- Technology signals: Website scraping, tech stack detection, digital presence analysis
- Enrichment: Apollo organizational data, AI-assisted scoring
- Industry research: LeadAngel (speed-to-lead statistics), Invoca (home services marketing data), CallRail (benchmark reports)
- Waste quantification: Synthesis of 4 Gemini Deep Research reports covering ServiceTitan integration, callback recovery economics, dispatcher workflows, and tech stack sprawl
Known Limitations:
- Selection bias: Database skews toward companies with Google Places presence; may underrepresent very small operators or companies without active web presence
- Detection bias: Technology detection relies on website scraping; some tools (particularly backend integrations) may not be visible
- Geographic concentration: 64% of sample from TX/FL/CA; regional patterns may not apply nationally
- Trade concentration: HVAC represents 59% of sample; trade-specific findings are more robust for HVAC than other trades
- Point-in-time data: Technology adoption changes; data reflects December 2025 – January 2026 snapshot
Alternative Explanations Considered:
- Low booking adoption could be intentional—some contractors prefer phone qualification
- HVAC lag might reflect higher-touch sales process rather than technology resistance
- Shadow systems may actually be efficient for specific operational contexts
What Would Disprove These Findings:
- If follow-up research showed high booking adoption correlates with lower close rates
- If HVAC companies with low digital adoption consistently outperform high-adoption competitors
- If the $324K waste figure doesn’t map to actual P&L improvements in documented engagements
We will update this analysis as our database expands and client engagement data validates or refines these patterns.
Sources
- HAIBRID Consulting Primary Database, 1,375 home services companies, December 2025 – January 2026
- HAIBRID Consulting Research Synthesis: ServiceTitan Integration Pain Points, Callback Recovery Economics, Dispatcher Workflow Mapping, Tech Stack Sprawl Analysis, January 2026
- LeadAngel, “What Is Speed to Lead? Statistics, Strategies, and Software to Improve Response Time”
- Invoca, “Home Services Marketing Statistics”
- CallRail, “Home Services Benchmark Report”
Published January 2026 by HAIBRID Consulting. For questions about methodology or data access, contact research@haibridconsulting.com.
All analysis based on aggregated industry data. Individual company performance varies. The $324K figure represents a modeled estimate for a typical $5M contractor based on research synthesis; actual waste depends on specific operational factors.