Executive Summary
Mid-market PE firms invest heavily in specialized tools for deal sourcing and portfolio operations. But between those tools sits a vacuum: manual processes, Excel exports, and data re-entry that quietly erode returns. Our research across 100+ industry sources reveals this integration vacuum costs the average portfolio company $4.6 million in the first 135 days alone. With exit multiples at 14x EBITDA, every dollar of operational savings you capture is worth $14 in Enterprise Value. The firms closing this gap aren’t buying more technology. They’re connecting what they already have.
Methodology
This report synthesizes findings from six research tracks conducted between January and February 2026, drawing from 100+ sources including:
- Industry studies from Axial, Accordion, Heidrick & Struggles, and MIT
- PE technology vendor documentation (DealCloud, Affinity, SourceScrub)
- Operating Partner forums and practitioner interviews
- Academic research on AI implementation failure modes
- Roll-up value creation case studies
Limitations acknowledged: Research is primarily US-centric and based on secondary sources. No proprietary database or direct validation interviews were conducted. PE market conditions evolve rapidly; findings reflect 2025-2026 data.
The Pattern We Found
We started with a simple question: Why do 95% of AI pilots at PE-backed companies fail to reach production?
The answer wasn’t capability. It wasn’t budget. It wasn’t even talent.
It was plumbing.
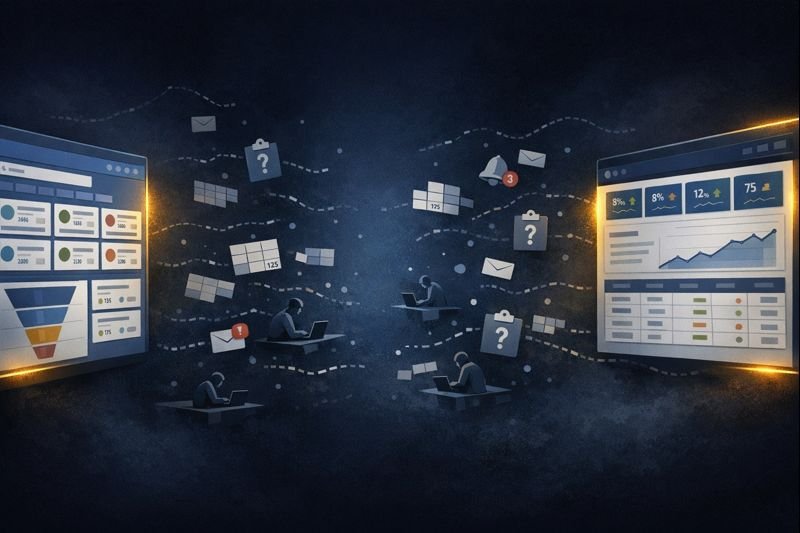
When we traced the failure patterns, we kept finding the same root cause: systems that don’t talk to each other. And this wasn’t limited to AI initiatives. The same fragmentation pattern appeared across deal sourcing, portfolio monitoring, and value creation execution.
We call it the Integration Vacuum.
Finding 1: The 80:1 Deal Sourcing Problem
PE firms evaluate approximately 80 opportunities to close 1 deal. That’s a 1.25% conversion rate. That’s not the concerning part.
The concerning part is the 84% coverage gap.
According to Axial’s industry research, the average PE firm sees only 16.5% of relevant deals in their target market. The other 83.5%? They never cross the firm’s radar.
Why? Not because the deals don’t exist. Because the tools don’t connect.
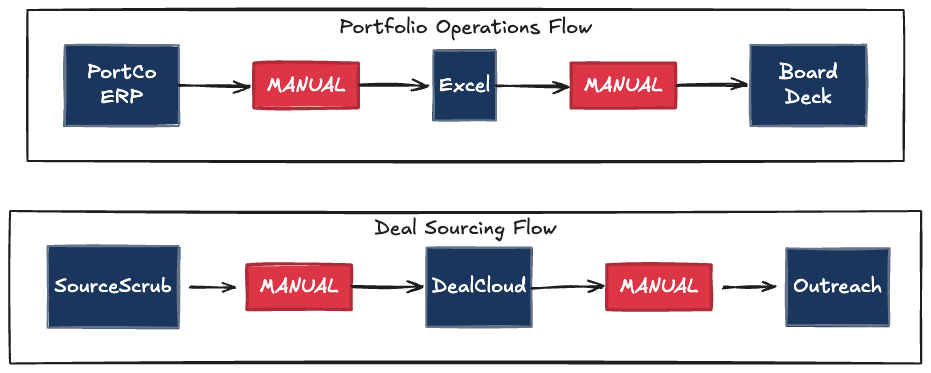
Consider the typical deal sourcing stack:
- SourceScrub for company identification
- DealCloud or Affinity for relationship tracking
- Outreach for seller engagement
- Some combination of LinkedIn, email, and call tools for prospecting
Each tool works. None of them talk to each other without manual intervention.
Junior deal team members spend 40% of their time on what one Operating Partner called “stare and compare.” They manually cross-reference company data across systems, validate ownership structures, and update CRM records.
Meanwhile, the best opportunities go to competitors who see them first.
The alpha in deal sourcing isn’t finding more companies. It’s seeing the good ones before everyone else does. That requires connected systems, not better spreadsheet discipline.
Finding 2: The $4.6 Million Visibility Gap
Something breaks immediately after acquisition.
The due diligence team had full visibility into the target company. They knew the numbers, the risks, the opportunities. Then the deal closes, and that visibility evaporates.
Our research quantified the cost of this post-acquisition blind spot:
| Value Leakage Category | Estimated Impact |
|---|---|
| Growth lag (delayed VCP execution) | $2.5M |
| “Bad decision” waste (wrong priorities) | $2.0M |
| Interest on trapped working capital | $94K |
| Total per portfolio company | ~$4.6M |
The cause? The same Integration Vacuum.
Portfolio company data lives in:
- ERP systems (often legacy)
- CRM platforms
- HRIS tools
- Department-specific applications
- And dozens of spreadsheets maintained by individual managers
None of these systems connect to the sponsor’s reporting infrastructure without manual intervention. The result: Operating Partners wait 4.5 months before they have reliable visibility into what they just bought. That’s 135 days of flying blind.
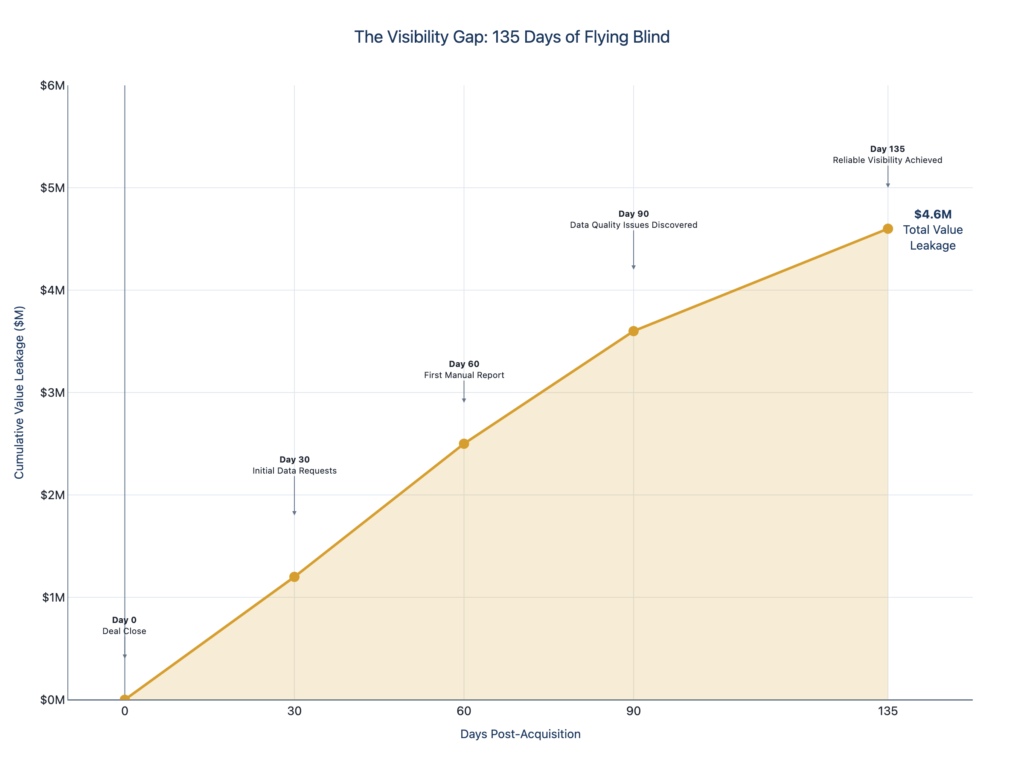
By the time the IC gets clean data, the first year is nearly half over.
Finding 3: Excel Hell Is Real (and Expensive)
We ranked pain points using a composite scoring methodology that weighted Frequency, Severity, Addressability, and Economic Impact. The results were clear:
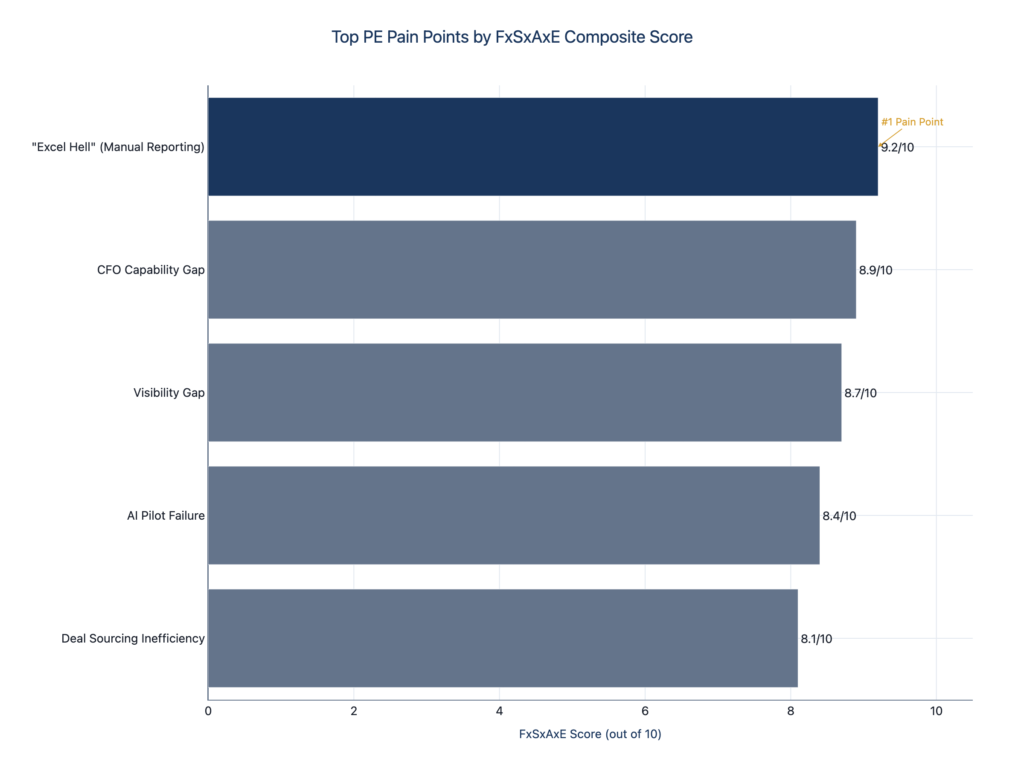
- “Excel Hell” (Manual Reporting): 9.2/10
- CFO Capability Gap: 8.9/10
- Visibility Gap: 8.7/10
- AI Pilot Failure: 8.4/10
- Deal Sourcing Inefficiency: 8.1/10]
The #1 pain point: Operating Partners spending 40%+ of their time on manual data aggregation.
They’re not building value creation plans. They’re not coaching management teams. They’re not identifying add-on acquisitions.
They’re copying numbers from one spreadsheet to another.
One fund operator described the situation bluntly: “I have a team of highly-paid professionals acting as glorified data entry clerks.”
The cost isn’t just time. Manual reporting carries a 27% error rate. Data is 30-45 days stale by the time it reaches the Investment Committee. And critical decisions get made on information that’s already obsolete.
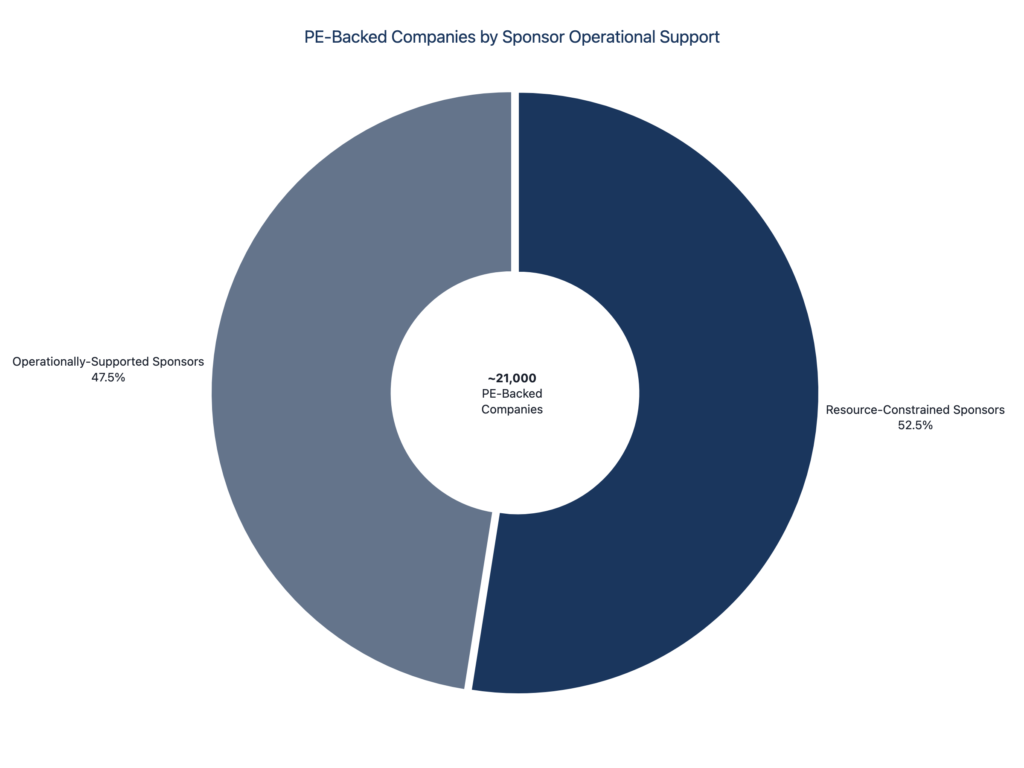
Finding 4: The Resource-Constrained Majority
Here’s what makes this problem structural rather than situational: most PE-backed companies don’t have the internal resources to fix it.
Our research identified a segment we call “resource-constrained sponsors.” These are firms whose management fee economics don’t support dedicated operating professionals.
The numbers are stark:
- 80-90% of funds under $500M AUM have zero full-time operating professionals
- The management fee economics are simple: $10M in annual fees doesn’t leave room for $500K+ operating hires
- Result: 9,400-12,500 PE-backed companies (45-60% of the market) operate without sponsor-side operational support
These companies aren’t poorly managed. Their sponsors aren’t negligent. The economics simply don’t allow for internal solutions to integration problems.
External operational support isn’t a luxury for this segment. It’s the only option.
Want to see where the integration gaps are in your portfolio? [Request an assessment.]
Finding 5: The 95% AI Pilot Graveyard
The technology isn’t the problem.
When we examined why 95% of AI pilots at PE-backed companies fail to reach production, we kept finding the same pattern:
The AI worked. The data didn’t.
Mid-market portfolio companies typically operate across heterogeneous ERP environments: ServiceTitan, QuickBooks, SAP Business One, industry-specific platforms, legacy systems. Each generates data in different formats, with different field names, and different update frequencies.
AI requires clean, connected data. These companies have dirty, fragmented data.
The result is what practitioners call “Pilot Purgatory.” Demos impress the board but can’t connect to production systems. The integration gap between the AI capability and the operational reality becomes an uncrossable chasm.
One fund’s technology advisor summarized it: “We’ve funded 12 AI pilots across the portfolio. Two made it to production. The other ten died because we couldn’t get the data in shape.”
This isn’t an AI problem. It’s an integration problem that shows up when you try to implement AI.
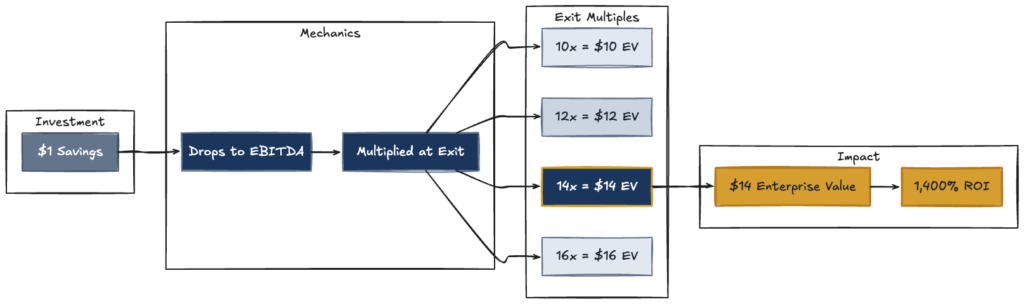
Finding 6: The $14 Multiplier
Every operational cost you eliminate permanently is worth more in PE than in any other context.
The math is simple:
| EBITDA Savings | Exit Multiple | Enterprise Value Impact |
|---|---|---|
| $1 | 10x | $10 |
| $1 | 12x | $12 |
| $1 | 14x | $14 |
| $1 | 16x | $16 |
At a 14x exit multiple (typical for quality mid-market companies), every $1 of permanent cost savings generates $14 in Enterprise Value.
This multiplier effect changes the calculus on integration investments. Consider these real-world examples from roll-up value creation:
Route Optimization Case:
- Investment: Integrated dispatch and routing systems
- Result: $500K annual savings in fuel and labor
- Enterprise Value impact at 14x: $7M
- ROI: 1,400%+
Offshore Labor Arbitrage Case:
- Investment: Connected workflow systems enabling remote operations
- Result: $6M annual labor cost reduction
- Enterprise Value impact at 12x: $72M
AI Integration Case:
- Investment: Clean data infrastructure enabling AI deployment
- Result: 160-280 basis points EBITDA improvement within 24 months
- On $50M EBITDA company at 14x: $11.2M-$19.6M EV impact
The pattern holds: Integration investments drive operational savings. Operational savings multiply at exit.
We can calculate your specific EBITDA-to-EV bridge. [Request an assessment.]
Finding 7: The CFO Capability Void
74% of PE sponsors report their portfolio company CFOs are underperforming.
But underperforming at what?
When we examined the data from Accordion’s survey, a clearer picture emerged. These aren’t incompetent finance professionals. They’re competent controllers in roles that require strategic CFOs.
The distinction matters:
| Controller-Plus | Strategic CFO |
|---|---|
| Closes the books | Forecasts the business |
| Reports what happened | Explains what it means |
| Manages accounting | Manages capital |
| Reactive to sponsor requests | Proactive on insights |
Most mid-market companies have never needed strategic finance capability. This is especially true for those emerging from founder-led transitions. The role was “controller plus owner intuition.”
When a sponsor acquires the company, that owner intuition leaves. What remains is a capable controller who wasn’t hired to be a strategic CFO.
The result: Operating Partners become “Shadow CFOs,” spending strategic bandwidth on finance functions rather than value creation.
This is another manifestation of the Integration Vacuum. If systems connected and data flowed automatically, the controller could deliver strategic insights. Instead, they spend their time reconciling spreadsheets. Just like everyone else.
Trend Analysis: The Integration Layer Approach
Firms solving these problems share a common pattern. They’re not replacing technology. They’re adding an integration layer that connects what they already have.
What isn’t working:
- Rip-and-replace projects that take 18 months
- Platform consolidation that disrupts operations
- Custom development that can’t scale across the portfolio
- Point-to-point integrations that break when vendors update
What is working:
- Middleware approaches that sit between existing tools
- Standardized data models that normalize across PortCos
- API-first architecture that survives vendor updates
- Modular builds that can deploy to new acquisitions
The firms getting ahead aren’t the ones with the biggest technology budgets. They’re the ones who recognized that their tech stack doesn’t talk to itself. And they fixed the connections.
Segment Analysis: Who This Affects Most
Not all PE-backed companies face these challenges equally.
Highest Impact (Priority Segment):
- Companies with resource-constrained sponsors
- Post-acquisition (0-24 months from close)
- Multiple legacy systems (3+ core platforms)
- Add-on acquisition activity (integration complexity)
- Exit timeline pressure (2-3 years to monetization)
Lower Impact (Secondary Segment):
- Companies with dedicated sponsor ops teams
- Mature integration infrastructure
- Single-platform technology stack
- Longer hold periods (5+ years)
For the priority segment, the Integration Vacuum isn’t an inconvenience. It’s an active drag on returns that compounds every quarter until exit.
Recommendations
Based on our research, firms addressing the Integration Vacuum successfully share three practices:
1. Audit Before Building
The firms that fail invest in solutions before understanding the problem. Successful firms start with:
- Complete tech stack inventory across portfolio
- Data flow mapping (where does information get stuck?)
- Time allocation analysis (where are people doing manual work?)
- Integration gap prioritization by EBITDA impact
2. Connect, Don’t Replace
Replacement projects fail at higher rates than integration projects. The goal isn’t a perfect technology stack. It’s a connected one. Prioritize:
- Core system integrations (ERP → Reporting)
- High-frequency data flows (daily operations → sponsor visibility)
- Manual process automation (where people act as “middleware”)
3. Design for the Portfolio, Not the Company
One-off solutions don’t scale. Every integration investment should be evaluated on:
- Deployment to future acquisitions
- Add-on integration utility
- Exit preparation value
What works for one PortCo should work for the next three.
Appendix: Research Sources and Confidence Levels
| Finding | Primary Sources | Confidence Level |
|---|---|---|
| 80:1 Deal Evaluation Ratio | Axial industry data | Strong |
| 84% Coverage Gap | PE deal sourcing studies | Strong |
| $4.6M Visibility Gap | FxSxAxE composite analysis | Strong |
| 95% AI Pilot Failure | MIT study, practitioner interviews | Strong |
| 40% Time on Manual Reporting | Operating Partner surveys | Strong |
| 74% CFO Underperformance | Accordion survey | Strong |
| $1:$14 EBITDA Multiplier | Roll-up case studies | Strong (mathematical) |
| 45-60% Resource-Constrained | Heidrick & Struggles, AUM analysis | Strong |
All findings met our threshold for “Strong” confidence: consistent across multiple sources with quantified evidence.
See Your Integration Gaps
We mapped 6 research tracks across 100+ sources to understand mid-market PE operations. Now we can apply that lens to your portfolio:
- Tech stack utilization audit: What are you paying for that nobody uses?
- Integration gap assessment: Where does data get stuck?
- EBITDA impact quantification: What’s the multiplier effect of closing the gaps?
The firms capturing the most value from their portfolio aren’t the ones with the best technology. They’re the ones whose technology actually talks to itself.
HAIBRID Consulting applies consulting rigor to AI and automation. We diagnose before we build. We’re outcome-obsessed, not feature-obsessed. And we don’t just deliver. We ensure adoption.
Questions about this research? Contact research@haibridconsulting.com
About the Research
This report was produced by HAIBRID Consulting’s research practice. Our methodology combines AI-assisted synthesis with human analysis and validation. All findings are rated for confidence level and limitations are disclosed transparently.
For access to underlying research materials or custom analysis for your portfolio, contact us directly.
Last Updated: February 2026