The Board Asked About AI Strategy.
You Changed the Subject.
Without PE portfolio automation, your Operating Partners spend 40% of their time chasing data across 15 systems. Your board wants real-time visibility. You’re assembling reports by hand.
These Aren’t Your Failures. They’re Systemic Patterns.
We’ve mapped exactly where PE portfolio operations break down. These patterns show up in every mid-market fund. The good news is they’re fixable.
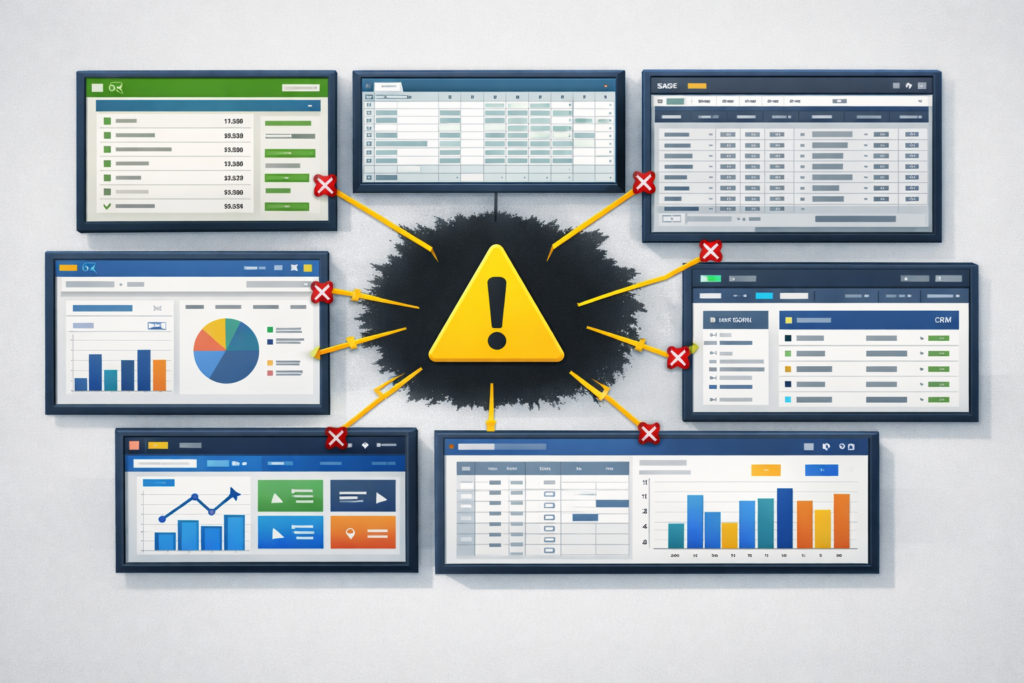
Portfolio Data Lives in 15+ Disconnected Systems
Your Operating Partners spend up to 40% of their time chasing numbers across NetSuite, QuickBooks, Sage, and Excel. Every board report starts with “Let me verify that number.”
PortCo A uses NetSuite. B uses QuickBooks. C is Excel-only. There’s no single source of truth.
Monthly consolidation takes 3 days because every company reports in a different format.
Board asks for real-time KPIs. You have 2-week-old spreadsheets. Maybe.

Manual Processes Eating Your Finance Team
Your CFOs spend 40-60% of their time on reporting instead of strategic work. They’re reconciling data by hand because the systems don’t sync. Meanwhile, AI initiatives stall.
AI invoice processing cuts 75% of time and 90% of errors. Your CFOs are doing it manually.
80-90% of funds under $500M AUM have zero dedicated ops professionals. You’re understaffed.
You hired for strategic leadership. You got a full-time data reconciliation role.
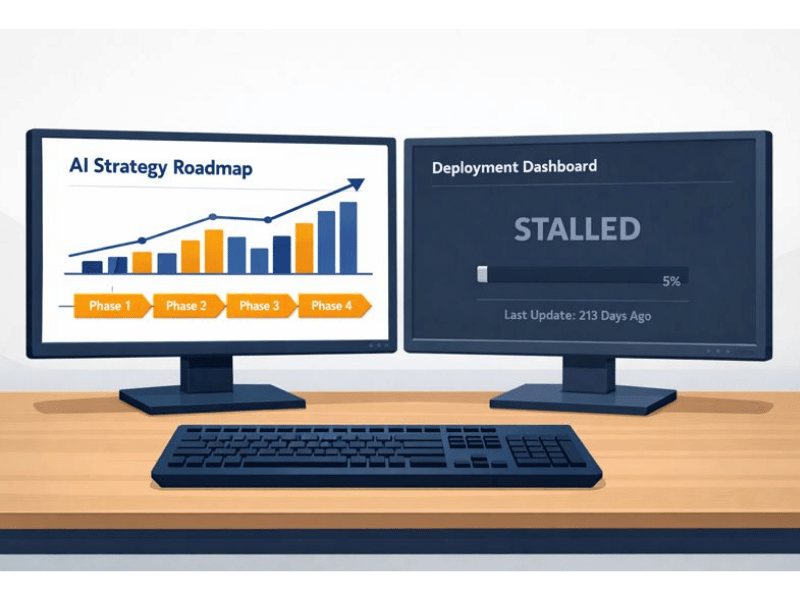
AI Strategy Decks That Never Reach Production
Your board wants AI. Your competitors are moving. But 95% of AI pilots never reach production. You’ve seen consultants deliver PowerPoints before. You need execution, not another deck.
You’ve paid for AI strategies that gathered dust. Nobody could actually build them.
Full-time AI takes 6 months to hire and ramp. Fractional delivers production AI in 90 days
Your sponsors ask about AI. You don’t have a production answer, just a strategy deck.
$4.6 Million Per Company
The average visibility gap per portfolio company. At a 14x multiple, every $1 of efficiency translates to $14 in enterprise value. You can’t capture what you can’t measure.
40%
Operating Partner time spent chasing portfolio data
4.5 months
To trust post-acquisition financials
$1 = $14
EBITDA efficiency to enterprise value
The problem isn’t your tech stack.
It’s the gap between systems. You don’t need transformation. You need integration and AI that runs in production.
Why Trust Us: Our PE portfolio automation strategy

A Methodology Built for PE Operations
Clear phases. Defined scope. Quantified ROI target. You get KPI maps, data bridge plans, automation backlogs, and governance cadence. Production systems your team owns and operates after we leave. No decks that sit on shelves. Implementation that ships.
One Engagement,
Portfolio-Wide Leverage
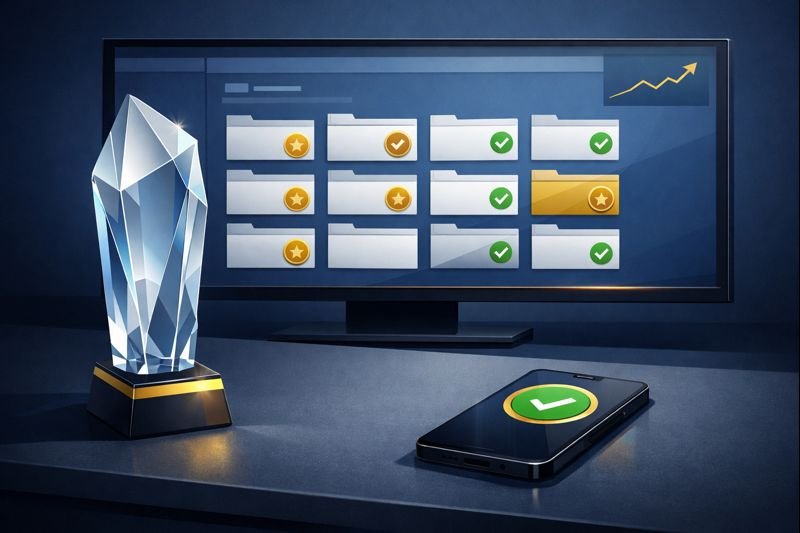
Every framework we build gets documented for replication. Your ops team deploys the same playbook across multiple portfolio companies without starting from scratch. One diagnostic investment funds the methodology your entire fund can use through exit.
We Build What Buyers Pay Premiums For
Data visibility, automated reporting, clean operational infrastructure, and the due diligence line items that move multiples. We’ve built Analytics Centers of Excellence managing $3B+ P&L at Fortune 250. Same playbook, applied to mid-market holds.
How We Fix It
We diagnose before we build. We automate with ROI in mind. We verify that it actually gets used.
Diagnose
We map your actual portfolio data flows, not what the ERP assumes. We interview OPs, CFOs, and the people who actually build the reports. We find where the numbers break down.
Hub
We establish your system of record for each KPI. No more conflicting numbers between NetSuite and the board deck. One source of truth across your portfolio.
Automate
We build production automations with measurable ROI. Quick wins that pay back in weeks, not quarters. If it doesn’t hit projected ROI, we rebuild it or credit the time.
Transfer
We train your team and verify adoption. Delivery without usage isn’t success. When we leave, your team owns the systems. We build successors, not dependencies.
The Vertical Proof
One Example of How Deep We Go
Home Services is one of PE’s fastest-growing roll-up verticals. We go deep on the verticals and operational patterns that matter most. Here’s what that research reveals.
ServiceTitan Implementation Drives Exit Multiple
Companies with fully implemented ServiceTitan command higher exit multiples. Operational maturity and data visibility translate directly to buyer confidence.
+1.0x turn on exit multiple
Route Density Optimization ROI
Geographic route optimization reduces windshield time and fuel costs. At a 14x multiple, half a million in savings creates seven million in enterprise value.
1400% ROI: $500K savings = $7M EV
Speed-to-Lead Response Impact
Leads contacted within 5 minutes are 21 times more likely to qualify than those contacted after 30 minutes. Most contractors respond in 47 hours. That gap is money.
21x more likely to qualify with sub-5-minute response
Home Services is where we’ve gone deepest. But the operational patterns are universal. Your portfolio has the same friction points. We know where to look.
See If We’re a Fit
A diagnostic conversation about your portfolio. We show you where the money is leaking. You decide what to do about it.
No commitment. No sales deck. Just a conversation about your portfolio operations and what’s actually costing you money.
Not Ready to Talk?
Get the Visibility Gap Calculator, the $4.6M framework for Operating Partners. Score your portfolio on 6 dimensions in 5 minutes.
Free. No spam. Just insights about your portfolio tech stack and where to start.