Stop Burning Time on Manual Work.
Start Deploying It to Growth.
AI automation consulting for Home Services contractors and PE portfolio companies. We diagnose the waste, build the fix, and deliver efficiency gains in weeks, not quarters.
Why We Diagnose First
We Understand Before We Build
Before a single line of code is written, we map your current state, quantify your pain in dollar terms, and produce a prioritized roadmap. This isn’t free discovery. It’s a paid diagnostic that stands on its own.
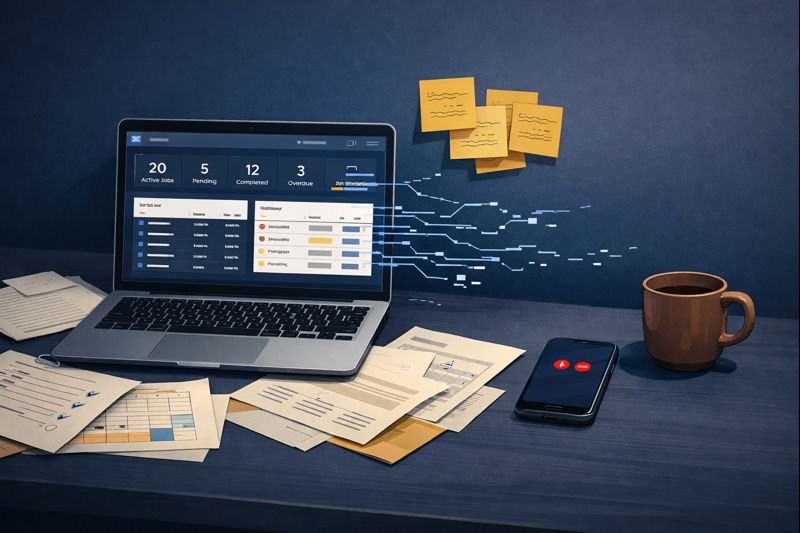
Workflow Reality Maps
See what’s actually happening in your operations, not what the manual claims.
Tech Stack Health Score
Know which integrations are solid and which are bleeding time and money.
ROI Math That Holds Up
Cost of doing nothing vs. return on automation, with real numbers.
Prioritized Roadmap
What to fix first, second, and third based on impact and effort.

We serve two industries, connected at the operational layer. Find yours.
Private Equity is rolling up Home Services at a record pace. HVAC, plumbing, and electrical are among the most active acquisition sectors. When PE acquires a trades company, they inherit operational friction that was already there: manual workflows eating margin, data scattered across tools, decisions waiting on people instead of systems.
Two industries. One operational problem. We’ve gone deep in both.
Home Services
Your larger competitors have operations teams, enterprise software, and systems that talk to each other. You’re running the same ServiceTitan they are, but your data lives in silos, and your team spends half their day on manual workarounds. The gap isn’t your people or your service. It’s your operational infrastructure.
27% of contractor revenue leaks through operational gaps
Explore Home Services Solutions
Private Equity
Your Operating Partners should be driving value creation. Instead, they spend 40% of their time chasing data across fragmented systems, manually consolidating reports, and waiting weeks for numbers. Integration failures cost $4.6M per portfolio company in unrealized returns. The gap isn’t effort. It’s infrastructure.
4.5 months from deal close to reliable reporting
Explore PE SolutionsYou’ve Seen This Movie Before
Consultant promises transformation. You invest time and money. Six months later, you have a deck and a dashboard nobody uses.
We build systems that run without you. Then we prove they work before you scale them.
How We Work
Automation That Pays for Itself
Four steps designed around measurable ROI, not features you won’t use.
Diagnose
We audit your systems, interview your team, and quantify the gap between current state and target state. No building until we understand.
Hub
We define data governance and master systems before writing a single workflow. If your data isn’t right, automation amplifies the mess.
Automate
We build with ROI in mind, proving value with quick wins before larger transformations. Every automation has a payback timeline attached.
Transfer
We train your team, document every workflow, and measure adoption before we leave. Built but unused doesn’t count as success.
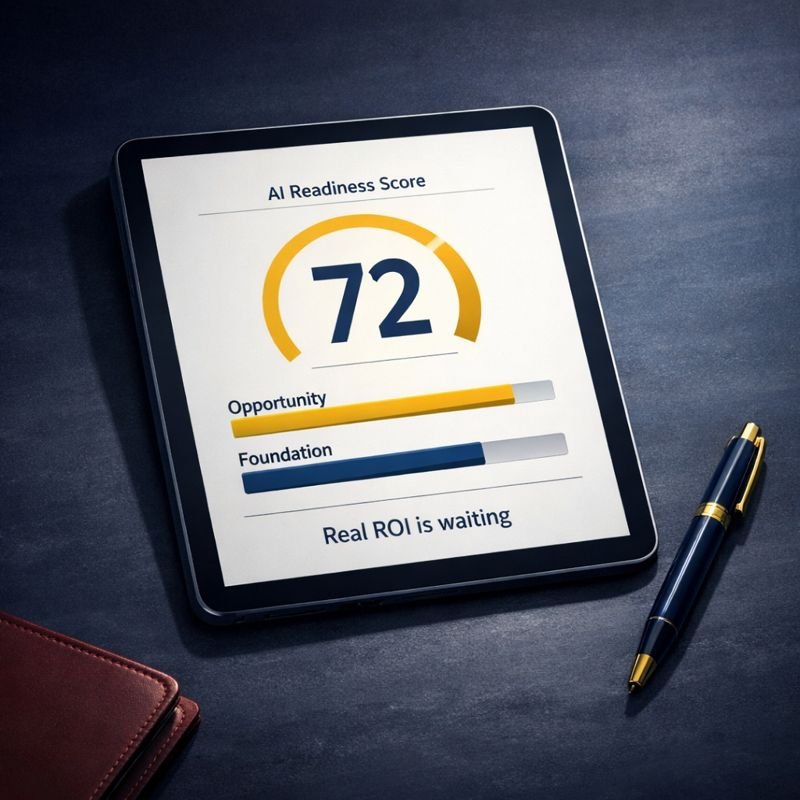
How Ready Is Your Operation for Automation?
5 minutes. Your AI Readiness Profile. FTE impact, foundation gaps, and a stage-specific path forward. This is the same diagnostic framework we use in paid engagements.
5 Minutes. Real Answers.
Most assessments waste your time with generic advice. This one calculates your actual operational burden in Full Time Equivalent (FTE) hours. Not manufactured ROI.
Your Operational Profile
See where your team’s hours are going. Which processes are burning bandwidth. How your foundation compares to automation-ready organizations
4 Pillars of Readiness
Data Governance. Process Documentation. Skills Readiness. Culture Readiness. Automation fails when the foundation isn’t there. We measure all four.
Personalized Analysis
Not a score and a sales pitch. You get a detailed email with FTE calculations, industry benchmarks, and recommendations specific to your stage.
Built for Operations
Plumbing company. PE portfolio. Professional services firm. Manufacturing floor. Operational friction follows the same patterns. We built for all of them.
Our Methodology. Your Preview.
This assessment reflects the diagnostic framework we use in paid engagements. It’s how we think about operational readiness. Now you can see it yourself.
We Don’t Just Advise. We Implement.
Most automation vendors show up with a demo. We show up with questions. What’s actually costing you time? Which tools are you paying for but not using? Where is data falling through the cracks?
Our engagements start with diagnosis and end with adoption.
Proof of Work
Client results, original research, and tools we’ve built along the way.

What 2,477 Contractors Said When No One Was Listening
View Article
From 60 Minutes to 25 Seconds: Automating Personal Injury Intake with AI and Clio
View Article